Economy · Forecasts explained
Brazil GDP: how to read the September forecast without treating it as measured growth
These are estimates in the September 2026 Macroeconomic Bulletin, not final annual results or a real-time October reading.
The figures and their reference date
On September 22, 2026, Brazil’s Ministry of Finance said its Economic Policy Secretariat (SPE) had revised its GDP growth forecast to 2.0% for 2026 and 2.3% for 2027. In the previous estimate, the figures were 2.3% and 2.5%. These are estimates from the September bulletin, not final results or a live reading for October. Naming the SPE and the publication date matters: it tells readers who prepared the scenario and when. The figures do not calculate an individual’s income, recommend an investment or imply that every sector grows at the same rate.
A worksheet for comparing forecasts
When comparing scenarios, record the institution, date, projected year and indicator definition. Do not mix an annual forecast with a quarterly change simply because both use percentages. A later revision should not erase the earlier estimate; it shows what the institution assessed at that point. This worksheet is an organizing aid, not an econometric model. If estimates differ, first compare assumptions, scope and date before deciding that either one describes an observed result or is definitively correct.
A hypothetical household-planning example
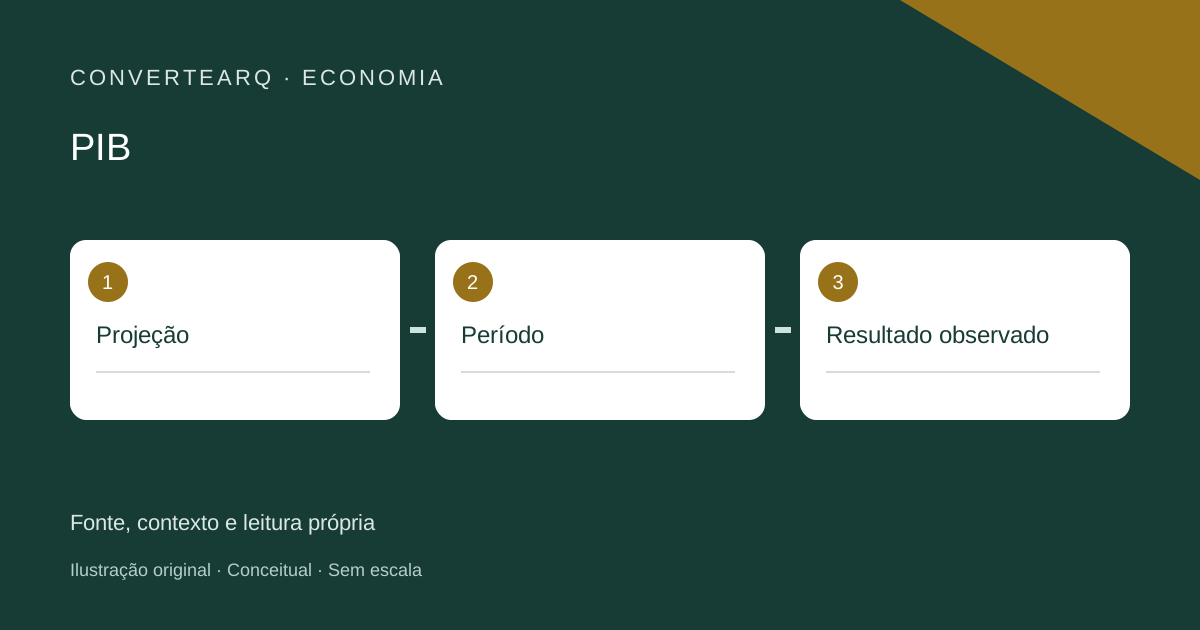
Imagine a household reading a growth forecast while planning expenses. The national figure may provide context, but it does not show that the household’s wages will rise. In this fictional example, the family keeps known income separate from assumptions about the future. That is not financial advice; it illustrates why an aggregate indicator cannot settle an individual decision. To follow the economy, check the official data series and its update. The diagram distinguishes a projection, its period and an observed result; it is not a measured graph, our own forecast or a direct link between GDP and personal income.
Source and verification
The source was published on September 22, 2026 and reports forecasts in the September Macroeconomic Bulletin. The figures refer to projected annual growth, not final results. The official page was checked on October 20, 2026.
ConverteArq commentary
Our view is that the word “forecast” should stay close to the number. Without its date and institution, an estimate can circulate as confirmed growth. The most useful editorial context is to show what changed and which period the scenario concerns. That lets readers track revisions without turning a projection into a promise about the country or any one person.
We also keep economic information separate from personal guidance. An aggregate indicator helps discuss trends and assumptions, while household budgets and investment choices depend on other data. A sourced worksheet with institution, date and period is useful without inventing a personal conclusion. It also makes later corrections easier when a new release appears.