Data guide
INMET: what September’s rainfall data show—and what they do not say about today
Morretes recorded 462.4 mm and Iguape 454.2 mm in the period reported. This guide separates observed totals, departures from climatology and forecasts for particular days.
The topic was prompted by the “inmet” search group observed in Google Trends Brazil on October 13, 2026, at 09:08:45 São Paulo time. A trend guides the topic; the facts below come from the cited source.
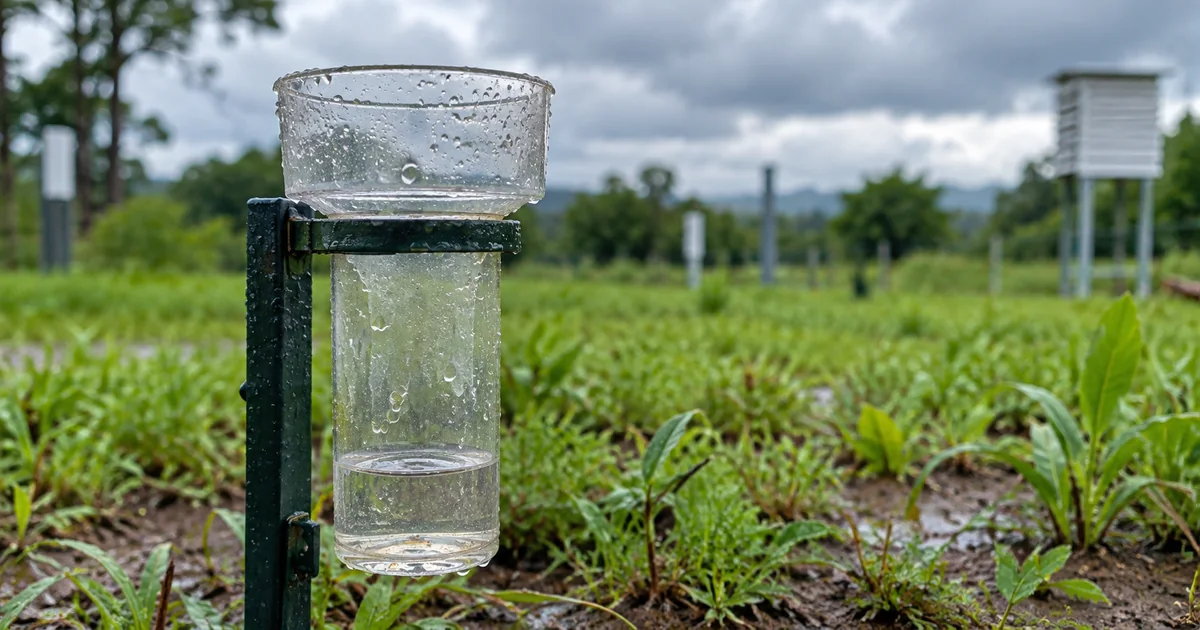
The observed month and the note’s publication date
On October 9, 2026, INMET published a note about meteorological highlights from September and updated it later that day. It compiles rainfall totals observed during the previous month and compares them with climatological references. A search for INMET prompted this document-based guide; it does not reveal why any individual searched or announce a new local alert.
The note lists 462.4 mm for Morretes, in Paraná, and 454.2 mm for Iguape, in São Paulo. These are monthly totals associated with the stations named in the document. They do not describe rainfall this morning or conditions in every neighborhood. The observation period and station are part of what each number means.
A total and an anomaly answer different questions
A total tells how much rain was recorded over a period. A departure compares that observation with a climatological reference. INMET expresses the percentage as observed rainfall minus climatological rainfall, divided by climatological rainfall, then multiplied by 100. A positive result means the observation exceeded that reference; it does not turn a monthly record into a forecast.
Hypothetical example: if the reference were 100 mm and the observed total 150 mm, the difference would be 50 mm and the percentage departure 50%. If another station had a 200 mm reference and recorded 250 mm, the difference would still be 50 mm, but the departure would be 25%. These values only illustrate the formula; they are not measurements from INMET’s note.
How to read the document in context
Start with the publication date and the month being described. Check the station name, then determine whether a figure is a total, a difference in millimeters or a percentage. Before comparing locations, make sure their periods and reference values are compatible. Millimeters and percentages measure different things, even when the numbers look similar.
For today’s weather, consult an official forecast or alert with its own location and validity period. The monthly note helps explain observations from September; it does not replace a daily forecast. A separate earlier ConverteArq article covered a cold-front forecast through October 13. This article addresses a different question: how to read observed rainfall and its climatological reference.
Sources and verification
Source checked October 13, 2026. The editorial comments are interpretation; hypothetical examples are labeled.
ConverteArq editorial comment
The formula becomes more useful when paired with an example whose assumptions are visible. The same 50 mm difference can represent different percentages depending on the reference. Showing that distinction helps readers avoid comparisons based only on the most striking number and clarifies that interpreting a report differs from taking our own meteorological measurements.
Keep the observed month beside the release date. A note published in October can describe September, while a forecast issued the same day may concern the coming hours. These time references support a careful reading. We explain the figures and their limits instead of presenting a monthly report as a real-time local warning.