Sport · explanatory guide
Brasileirão 2026 table: points, matches played and tiebreakers
Prepared with AI assistance, identified sources and original editorial commentary. No live standings or match results were reproduced. Editorial policy
A league-table search is easier to answer when points, matches played and the competition rules are read together. This guide explains the 2026 Série A format and the order the CBF published for resolving a final tie. It does not reproduce live standings or results.
This guide was prompted by the search “tabela brasileirão” (“Brasileirão table”), observed on Google Trends Brazil on October 12, 2026 at 09:03:59 Brasília time. The trend suggested a reader question; the facts below come from the identified CBF document. Google Trends.
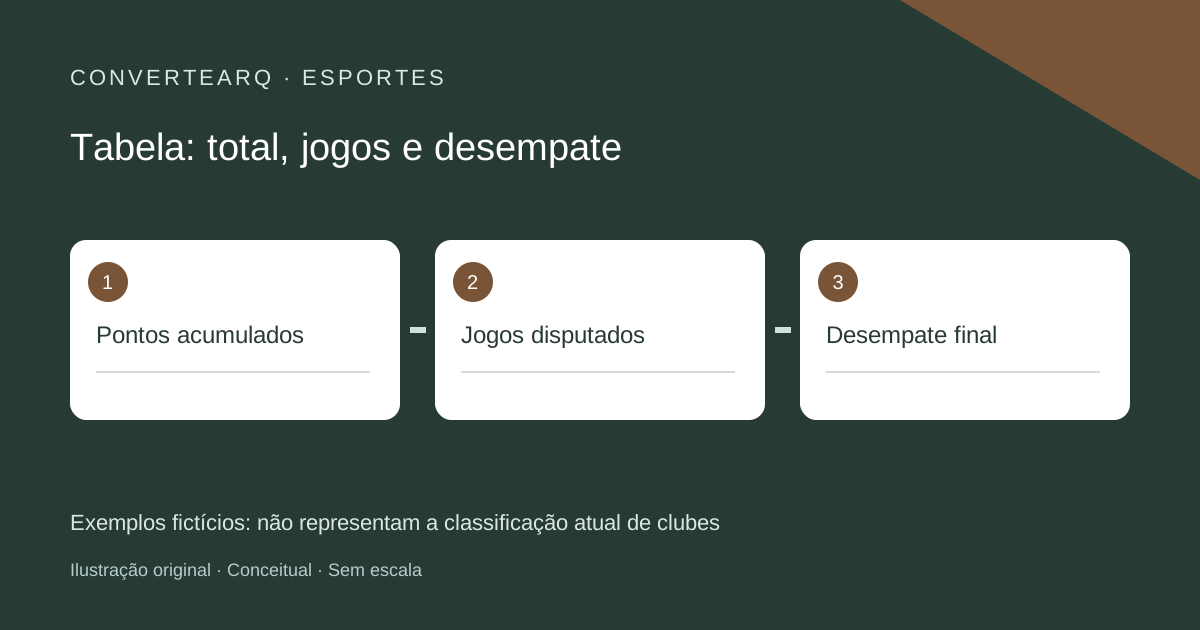
What the 2026 regulation says
The CBF’s Specific Competition Regulations for Série A 2026, dated December 15, 2025, set a double round-robin season: 19 first-half matches and 19 return fixtures. The champion is the club with the most points. Article 15 orders the final tiebreakers as: wins, goal difference, goals scored, head-to-head record, fewer red cards, fewer yellow cards, and a drawing of lots.
Head-to-head considers the two matches between the tied clubs and does not apply when more than two clubs are tied. This guide describes the regulation consulted for the final classification. It does not claim an intermediate table position has already decided a title or qualification.
Why matches played change the comparison
When reading a table, note the competition, season and update time. Compare points with matches played. A position by itself does not show how many matches each club has had the chance to play. Keeping those fields together is a way to read the official table, not a replacement for it.
Fictional example: Azul has 42 points after 24 matches; Verde has 40 after 22. Their arithmetic averages are 1.75 and about 1.82 points per match. These calculations use only the invented figures. They do not change the points table, alter the rules or predict future results.
A simple comparison checklist
Record points, matches played, wins, goals scored and goals conceded side by side. If clubs are level on points, check the regulation’s sequence before using any one statistic to explain their order. Save the official page and the time you checked it. If the figures come from different update times, find a common update before comparing. Azul and Verde are fictional names, not real clubs.
Sources
Regulation dated December 15, 2025. The CBF announcement and attached competition documents are linked below.
ConverteArq editorial comment
Our view is that a table is easier to understand when readers can see what produced a position. Points are the central measure; matches played add context. A points-per-match average can answer a different question, but it is not the official ranking and does not estimate the chance of winning the title. Treating those measures as interchangeable creates a false sense of precision.
We use a fictional example instead of filling gaps with unchecked scores. The CBF document is identified with its historical date: this page explains those published rules; it is not a claim that the rules were announced today.