F1 qualifying: what lap times and telemetry can explain
Prepared with AI assistance; sources are identified and the commentary is original. Editorial method and corrections
A search for “F1 qualifying” may mean a session result or the championship table. Car data can help explain performance, but only when its source and context are clear. This guide is not a live standings page and does not claim access to team telemetry.
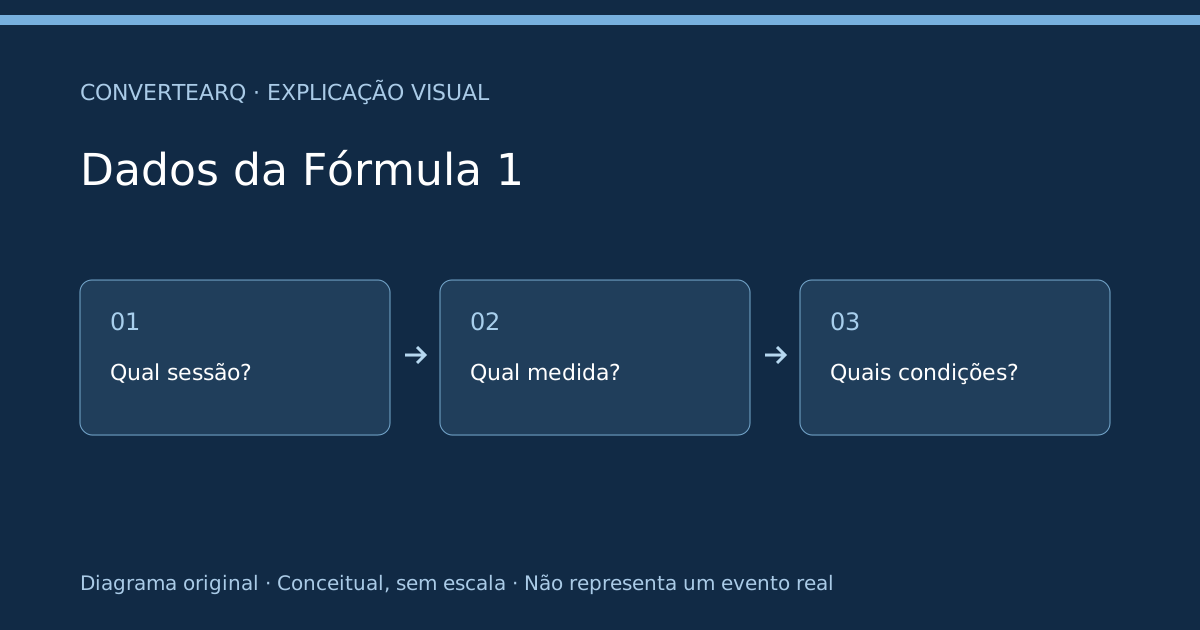
First identify which classification you mean
Before comparing a graphic or table, determine whether it shows a qualifying session, a race result or the points accumulated in the championship. Note the event, season, session and update time. A crop without those details can put accurate numbers into a misleading comparison.
This page does not announce a pole position, winner or current driver ranking. The search prompted an explanation of how to read results, not invented sporting data.
What car data can add
In an F1 Explains episode published October 31, 2025, Formula 1 discussed how drivers and engineers use acceleration, braking, steering and sensor data to study performance. Race engineer Tom Stallard and former F1 driver Jolyon Palmer explained how information is recorded, returned to teams and reviewed. That episode is background published earlier, not a new announcement.
A lap time summarizes an outcome. A sequence of data may help locate where differences occur around a lap. Seeing a difference is not the same as knowing its cause; interpretation depends on the data source, the session and comparable conditions.
Compare data responsibly
Imagine two fictional traces showing a speed difference through one corner. To discuss why it appears, an analyst would need to know the lap conditions and how the data was aligned. The drawing alone cannot prove a technical fault or an equipment advantage. This example does not use team data.
Check whether the graph compares the same session, circuit and compatible conditions. Read the units and horizontal axis: distance-based and time-based views can look different if compared without explanation.
Questions to ask of a numerical analysis
A useful analysis identifies where its data came from, which session it covers and what was measured. Estimates and illustrations should be labelled before a conclusion is drawn. Missing data should not be turned into zero just to fill a table.
This article uses no proprietary telemetry numbers. Its illustration organizes questions; it is not a car measurement. For positions and results, consult the official publication for the event. For an interpretation, look for the method linking the data to the claim.
Sources and verification
Formula 1’s official F1 Explains episode was published October 31, 2025 and checked for this translation. The Portuguese article was published October 11, 2026. This translation does not use team telemetry or report a live result.
ConverteArq commentary
There is a useful parallel between reading race data and reading AI benchmarks: a number matters only when we know the conditions that produced it. The comparison is about a shared reading skill, not an assertion that the two subjects are equivalent. Checking units, origin and conditions helps prevent a visual comparison from carrying more weight than the evidence supports.
We think good sports analysis explains the path to its conclusion. Readers can consider a performance hypothesis while recognizing that it remains a hypothesis. Stating what was measured and what was inferred makes technical coverage more engaging because it invites readers to follow the question without implying access to information the author does not have.